
 (C:)
(C:) 3d
3d chain-thought
 web-python-console
 SRT data analysis
 JupyterLite
 U-FISH
 写给生物信息初学者
 AniNet
 Boids
Boids
 EM 算法 1. how it works
") 翻译:Inside Python Virtual Machine(前三章)
翻译:Inside Python Virtual Machine(前三章)
 PubMed bio-conception network example
 three.js test page

The KS-Test(Kolmogorov-Smirnov test) is a kind of non-parametric (the distribution information of the data is not needed) test for determine if two datasets differ significantly. The null hypothesis is that the two samples are drawn from the same distribution.
The key idea of KS-Test is to construct a statistic (which called D statistic) by the cumulative fraction function (empirical distribution function) of two datasets. According to the definition on the KS-Test WiKi page:
The CDF(cumulative fraction function) $F_n$:
\[F_n(x) = \frac{1}{n} \sum^{n}_{i=1} I_{[-\infty,x]}(X_i)\]Where the $I_{[-\infty,x]}$ is the indicator function, it equal to 1 if $X_i \leq x$ else it equal to 0. Then the D statistic:
\[D_{n,m} = \mathop{sup}_{x} | F_{1,n}(x) - F_{2,n}(x) |\]Where $F_{1,n}$ and $F_{2,n}$ are the CDF of the first and second dataset, and $\mathop{sup}_{x}$ is the supremum function.
Intuitively, the D statistic is the max difference value of two cumulative functions. as shown in following figure:

The red line is the CDF of a dataset, the blue line is another one, and the black arrow line indicate the max distance between them, that is the statistic D.
Benefit the design of the statistic D, KS-Test is sensitive to differences in both location and shape of the CDF of the two samples. We can do some experiments to demonstrate this feature.
Experiments
Here, we use the implementation of two sample KS-Test in scipy.
Firstly, we generate two datasets from two normal distribution they have same $\mu$ but different $\sigma$.
>>> import numpy as np
>>> np.random.seed(42)
>>> s1 = np.random.normal(0, 1, 200)
>>> s2 = np.random.normal(0, 1.5, 250)
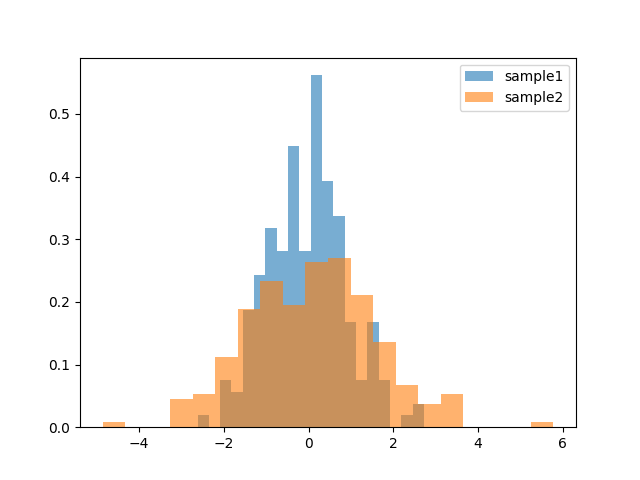
We can check the distrinution of them with hist plot:
>>> import matplotlib.pyplot as plt
>>> _, _, h1 = plt.hist(s1, 20, density=True, alpha=0.6)
>>> _, _, h2 = plt.hist(s2, 20, density=True, alpha=0.6)
>>> plt.legend([h1[0], h2[0]], ['sample1', 'sample2'])
>>> plt.show()
Next, we do the t-test to compare these two samples:
>>> from scipy.stats import ttest_ind
>>> ttest_ind(s1, s2)
Ttest_indResult(statistic=-1.0619794453886573, pvalue=0.2888171520114434)
>>> ttest_ind(s1, s2, equal_var=False)
Ttest_indResult(statistic=-1.116168623094328, pvalue=0.2649835475758269)
The p-value is too high, we can not reject the null hypothesis at 0.05 level. Two data set are different, but the t-test cannot see the difference.
But if we do the KS-Test:
>>> from scipy.stats import ks_2samp
>>> ks_2samp(s1, s2)
Ks_2sampResult(statistic=0.17499999999999993, pvalue=0.0018698874195532526)
The difference was be shown by the small p-value.
More strictly, repeat the random sampling the caluculate the p-value many times. See the distribution of p-value get from the t-test and the KS-Test:
np.random.seed(42)
n = 200
mean1 = 1
mean2 = 1
sigma1 = 1
sigma2 = 1.5

p_ttest = []
p_kstest = []

for _ in range(300):
    s1 = np.random.normal(mean1, sigma1, n)
    s2 = np.random.normal(mean2, sigma2, n)
    r_t = ttest_ind(s1, s2)
    r_ks = ks_2samp(s1, s2)
    p_ttest.append(r_t.pvalue)
    p_kstest.append(r_ks.pvalue)

fig, ax = plt.subplots(figsize=(6, 5))
plt.boxplot([p_ttest, p_kstest], labels=['t-test', 'ks-test'])
plt.hlines(y=0.05, xmin=0, xmax=3, color='blue', linestyles='--', linewidth=0.5)
plt.ylabel("p-value")
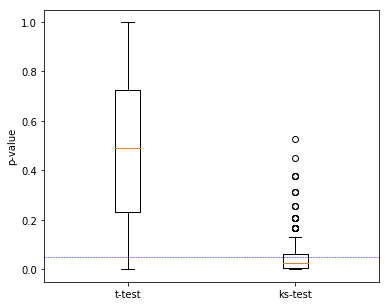
From this we know that the KS-Test is a good tool for compare two datasets, when the mean value of them are similar.
Email: nanguage@yahoo.com